By Aaron Price, AMS Director of Education
Greetings from Weather with a Twist in Houston, where the people who sign my checks are hosting their 106th Annual Meeting. Last night, from my 19th-floor hotel room, I watched a fleet of colorful salt trucks slowly apply brine on the highway in front of an endless line of confused drivers. I suppose this happens rarely enough here that the trucks haven’t figured out the concept of staggering the lanes so people can pass. Or that brine washes away in rain.
As in years past, I’ll post a couple of articles with quick-hit summaries of interesting research I saw in sessions. Then, for better or for worse, we’ll be back to our regularly scheduled programming next week.
Warnings and TORP Couplets
The continued improvement of tornado warnings has been one of the great success stories of the National Weather Service. That progress is the result of research into tornado formation, detection, and also the warning system itself. Despite these gains, uncertainty remains an inherent part of tornado detection, making systematic evaluation of warning performance especially important. Trey Holiday and coauthors conducted one such evaluation of the accuracy of over 2,000 tornado warnings issued by the National Weather Service in 2018.
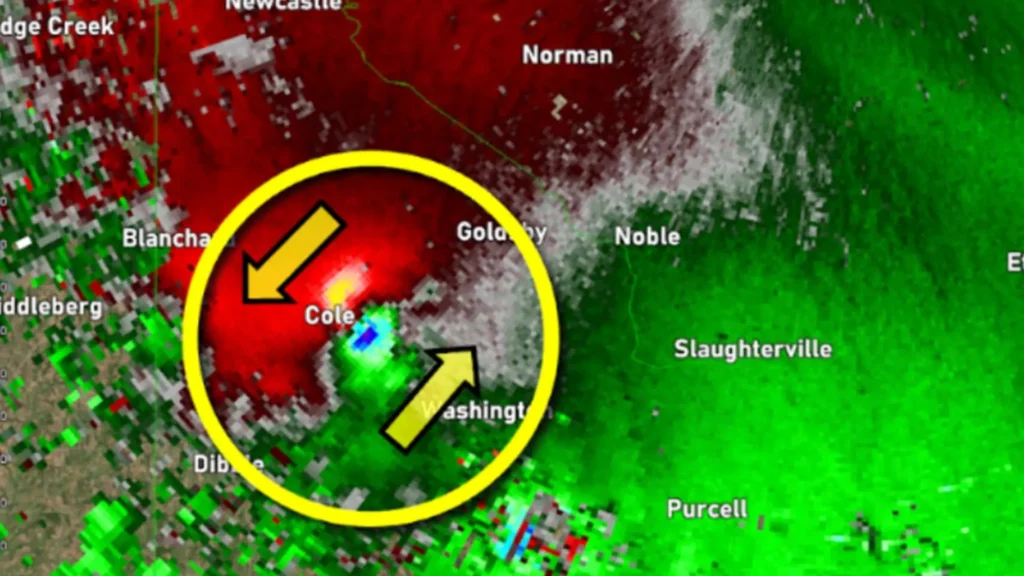
Looking at archival radar data, they used a machine learning technique called TORP to estimate the probability of a tornado actually occurring in a warning area. TORP uses data from the WSR-88D radars to identify areas where wind is moving rapidly toward the radar on one side and away from it on the other, indicating rotation (a.k.a. “couplets”).
Recall that tornado warnings are intended to indicate that a tornado has been detected, not merely forecasted. Those detections are inherently imperfect: radar signatures are noisy, and visual confirmation can be ambiguous due to rain, debris, darkness, etc. As a result, forecasters always have to deal with false positives (when a warning is issued but no tornado occurs) and false negatives (when a tornado occurs without an issued warning).
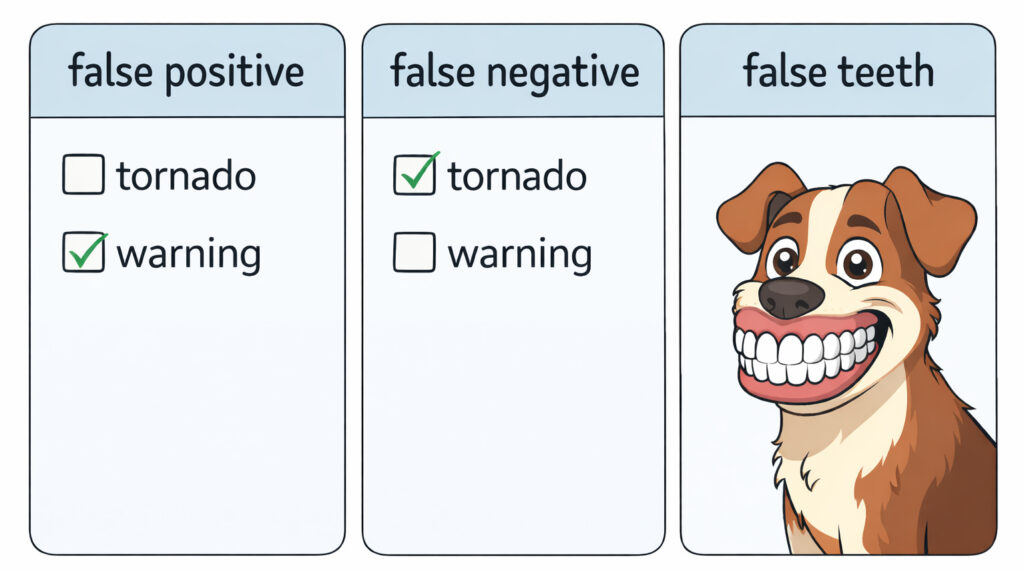
The results shows that forecasters tend to prioritize avoiding false negatives over false positives, reflecting the much higher stakes of a missed tornado (death!) compared to an unnecessary warning (annoying beep on one’s phone!). They also found that false positives are less common in more densely populated areas, suggesting that forecasters may apply stricter warning criteria in areas with greater societal impacts. This pattern raises important questions about unconscious bias and equity in issuing warnings.
This study was supported by an NSF REU grant, a super-popular and effective program that provides undergraduate science students with research opportunities and mentorship. Such students often report some of the coolest results at these conferences.
Born of the Wind
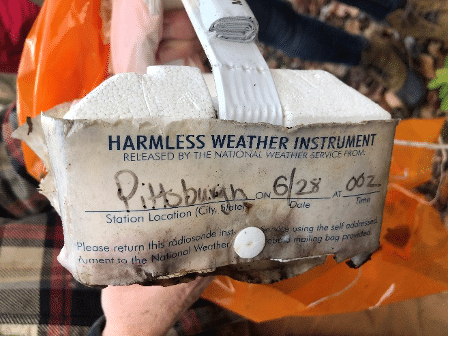
Ground-based observations are just that: records of what’s going on at the surface. But the atmosphere is in 3D. Most of it is much above the ground. Satellites, radar, and other remote sensing provide some data about what’s happening up there, but there is nothing better than a good old-fashioned weather balloon taking direct measurements as it flies. It’s critical to our forecasting. And this is why weather balloons are always launching, and then also always falling.
Jake Spisak led a team from Winborne Systems and the Scripps Institution of Oceanography to present on a network of long-duration weather balloons. Usually the balloons go up, travel a bit, then fall after a couple of hours of glorious freedom. But their system goes up and stays up for thousands of hours, flying all over the world and into the most remote regions.
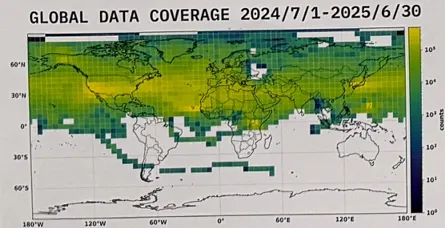
So far, they’ve launched over 5,800 flights totaling more than 1,000,000 hours of flight time (above). They presented calibration results comparing the accuracy and precision of their instruments with more traditional balloons (radiosondes) launched alongside some of them. The instruments were quite accurate, which is not surprising, as it is unlikely they would have published the work otherwise. What is surprising is the sheer scale of the data collection effort. By the end of 2026, they expect to have more than 400 balloons aloft at the same time, extending coverage of the Southern Hemisphere. And there are lots of atmospheric scientists salivating over that data.
The Return of… Megaflash
One of the first WWAT newsletters was about megaflashes – lightning flashes more than 100 km long. I’ve yet to see one myself, despite pleading and crying to the weather gods. Perhaps I need to move to Florida, where Nick Stewart, of the Midwest Weather Center, has been tracking lots of megaflashes detected near NASA’s launch facilities.
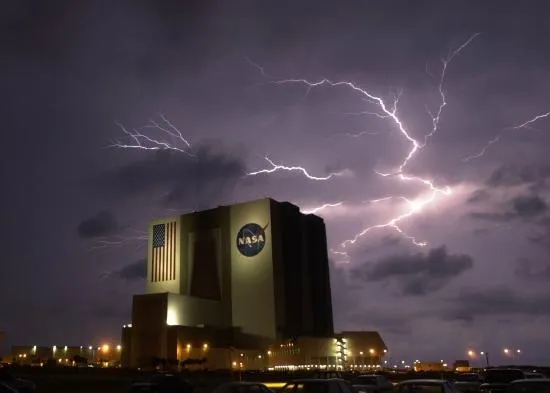
He combined data from the Geostationary Lightning Mapper (GLM) on NOAA’s Geostationary Operational Environmental Satellites (GOES) with a ground network of lightning-detection devices in eastern Florida known as MERLIN. Lightning is both very common in Florida and also very dangerous for rocket launches (and cows). So Florida has one of the best detection networks in the world.
Stewart found many megaflashes that extended over the various launch complexes in the region. One such flash, on August 5, 2025, lasted more than 5 seconds and was over 173 km long! It struck the ground in seven different spots along that path. And it did travel right over Kennedy Space Center.
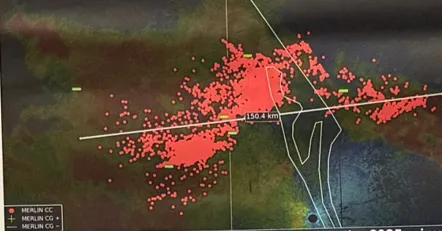
Tracking these flashes is important because they can occur from longer distances than typically associated with lightning. Right now, there is a rule that prohibits launches when there is lightning within 19 km (10 nautical miles) of the launchpad. Given the ramifications of a lightning strike during a launch, more consideration may need to be given to thunderstorms that are more than 100 km away. In 1987, a rocket and satellite was destroyed by lightning less than a minute after launching. Lightning risk may extend well beyond traditional safety thresholds, and that launch criteria may need to evolve as our understanding of long-range lightning improves.
More from AMS tomorrow…
We are grateful to Lockheed Martin for a grant supporting this newsletter.

Our archive of WWAT articles is here.
During the preparation of this work, the author(s) used ChatGPT-5.2 to copyedit text. WWAT’s author(s) reviewed and edited the content as needed and take(s) full responsibility for the content of the publication.
Weather with a Twist is published by the American Meteorological Society.