by Gerald A. Meehl et al.
Key Messages From
Earth, wind and fire: Are Boulder’s extreme downslope winds changing?
by Gerald A. Meehl (NSF National Center for Atmospheric Research), Christine A. Shields, Brendan M. Myers, McKenzie L. Larson, Dale Durran, Muntaha Pasha, Annareli Morales, Aneesh Subramanian, Andrew C. Winters, Paul Schlatter, and Morris Weisman. Published online in BAMS, July 2025. For the full, citable article, right click the title link for options.

The NSF National Center for Atmospheric Research (NCAR) was at the epicenter of mega-downslope windstorms that wracked Boulder in the 1960s, 1970s, and 1980s when extreme windstorms were not unusual. But after the 1990s, the weather station anemometer at NSF NCAR, which replaced the previous anemometer that recorded the huge gusts, didn’t record a peak gust much over 100 mph. What changed? Our detective story describes the search for causes of the apparent decrease in the strength of extreme winds at NSF NCAR and their impacts in the Boulder area. The suspects we examine include a change in instrument location, changes in building codes, and increasing roughness length from tree growth. But changing atmospheric conditions emerge as a chief culprit.
Due to Boulder’s location at the eastern foot of a north–south mountain range (earth), which presents a continuous barrier to the prevailing upper-level westerlies conducive to forming mountain waves, it is susceptible to the destructive downslope winds (wind) at the trough of the mountain wave that are often accompanied by fires (fire), such as the downslope wind-driven Marshall Fire just east of Boulder on December 30, 2021, that destroyed nearly 1,100 homes.
When the NSF NCAR Mesa Lab building was built on a mesa on the southwestern edge of Boulder in 1967, an analog propeller anemometer was erected atop a 10-meter mast on NSF NCAR’s six-story-high tower A. The propeller anemometer was disabled in 1996, and wind measurements at Mesa Lab were then made by the WXT sonic anemometer lower down at 2 meters above roof level on the weather station that was installed in 1996. In 2017, a sonic Gill anemometer was mounted back atop the mast at 10 meters above roof level where the original propeller anemometer was located to facilitate apples-to-apples wind measurements to quantify the change in instrument and location on the measurements of peak gusts.
The old strip chart recordings from the original propeller anemometer were not saved, but from newspaper accounts, though necessarily anecdotal, Catherine Smith at NOAA compiled reports of peak gusts from downslope windstorms recorded at NSF NCAR from extreme windstorms that produced the most damage from the late 1960s until the propeller anemometer was disabled in 1996 and a continuous record of peak gusts began with the weather station anemometer.

(top) The two anemometers atop the NSF NCAR Mesa Lab (yellow circles); contours indicate approximate westerly wind streamlines over the building, with wind flow during downslope wind events from left (west) to right (east); the propeller anemometer at left on the mast at 10 meters above roof level recorded the huge wind gusts of the windstorms of the 1960s, 1970s, and 1980s. The WXT anemometer lower down to the right at 2 meters above roof level was installed in 1996, and after its installation there were no gusts above 100 mph recorded by this instrument (Gerald Meehl photo). (bottom) Time series of daily maximum wind speed for days for measured gusts greater than or equal to 70 mph for January 15, 1967–February 26, 2024; reports of events recorded at NSF NCAR only (light red); peak gusts measured by the WXT anemometer installed in 1996 atop a 2 meter mast (dark red), dark horizontal line denotes 100 mph wind gusts, dark vertical line at 1996 marks when the anemometer instruments and location on the NSF NCAR roof changed.
The damage associated with those downslope windstorms was devastating, resulting in significant structural damage to homes and businesses. The January 1982 event was the last severe damaging windstorm in Boulder.
We examine the various factors that could have produced either the perception of reduced wind impacts, or an actual weakening of extreme downslope winds. The decrease of peak gusts during severe downslope windstorms measured at NSF NCAR is real, as indicated by measurements from sonic anemometer instruments in two locations on the Mesa Lab roof in the 2020s compared to earlier propeller anemometer measurements prior to 1996. If the more recent wind gusts measured by the WXT weather station anemometer were corrected to be comparable to the wind gusts measured atop the tower, even with the largest measurement adjustment of 16% for the top 0.1% of gusts, the strongest post-1996 gusts of 100 mph corrected to 116 mph still lie well below the big wind events in the pre-1996 period, when there were seven windstorms with gusts well above 117 mph, with four events greater than 120 mph. Therefore, the reduction of peak gusts after the 1990s measured at NSF NCAR cannot be explained only by changes in the siting and type of anemometer used. Additionally, NOAA Storm Reports from three counties along the Colorado Front Range (including Boulder County) suggest a secular decrease in strong wind gusts, and the ERA5 reanalysis shows a large-scale decrease in lower tropospheric winds in the lee of the Rockies below about 600 hPa in the more recent period.
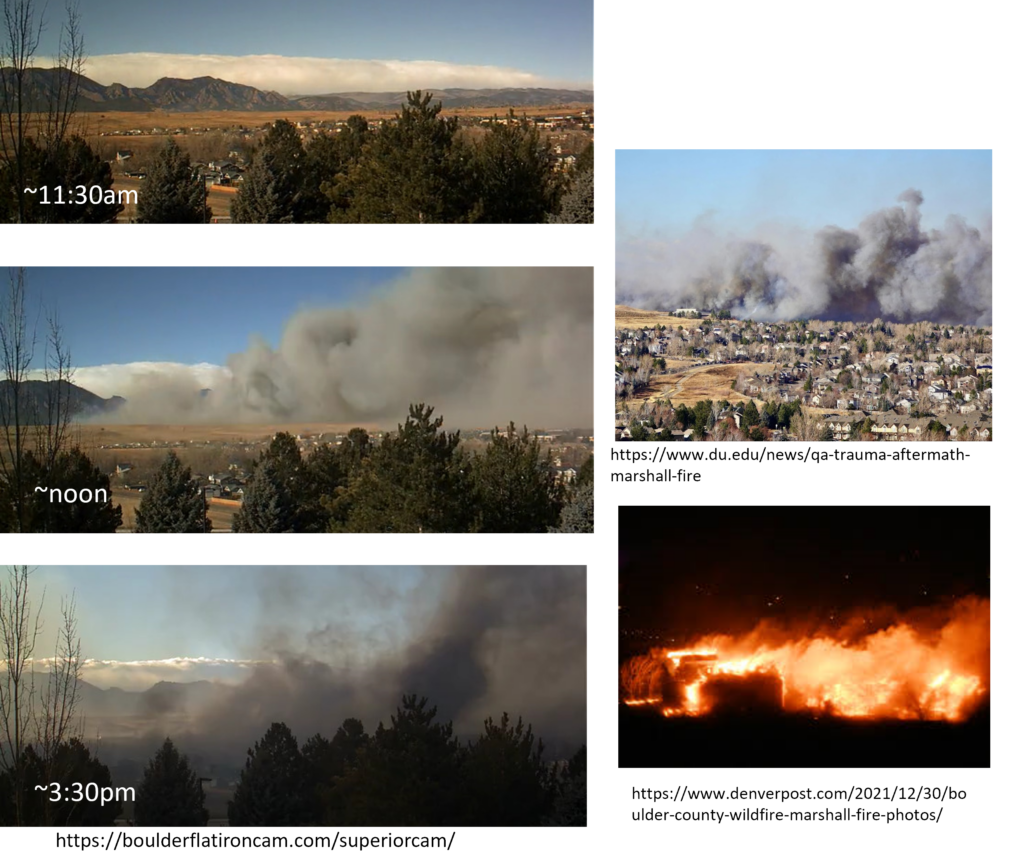
(left) Time sequence of the December 30, 2021, downslope wind event that drove the Marshall Fire into subdivisions just east of Boulder, taken from a webcam in the town of Superior; note the foehn wall (wall cloud) covering the Continental Divide, a typical feature of downslope wind events, in the first frame; (right) the wind-driven Marshall Fire burning into the towns of Superior and Louisville, respectively, just east of Boulder (top-right photo: https://www.du.edu/news/qa-trauma-aftermath-marshall-fire; bottom-right photo: https://www.denverpost.com/2021/12/30/boulder-county-wildfire-marshall-fire-photos/).
Tightening building codes in Boulder to equip structures to resist wind damage has undoubtedly contributed to reducing the damage from windstorms. The increase of roughness length from tree growth in Boulder over the decades also likely contributed to somewhat reduced winds at the surface. But the decreases in peak gusts at NSF NCAR and the larger-scale decreases of peak gusts along the Front Range are associated with warming of the midtroposphere over this time period along with a strengthening of mean winds above 500 hPa and a weakening of mean winds near 700 hPa near Boulder, thus increasing vertical wind shear. There is some evidence in the literature that these changes in atmospheric conditions could result in weakened mountain waves over the Rockies and thus contribute to the reduction in peak gusts at NSF NCAR. To quantify what is causing these changes in Boulder’s winds, a study is underway to run the WRF model for historical case studies of strong downslope wind events in Boulder to contrast the effects of historical and future forcings, the latter from the CMIP6 models. This research will address how these changes in mean climate may affect the characteristics of mountain wave formation and consequent severe downslope wind events, and provide prospects for the future of such events.
METADATA
“My father was a dryland wheat farmer in eastern Colorado. Since dryland wheat depends 100% on naturally occurring precipitation, I grew up very aware of all the factors related to weather and climate that could affect the wheat crop. Consequently, ‘dryland wheat farmer’ was taken right off the list of career options, but my childhood experiences did motivate me to study weather and climate.”
—Gerald Meehl, NSF National Center for Atmospheric Research
A Brief Conversation
with the Author
BAMS: What would you like readers to learn from this article?
Gerald Meehl (NSF National Center for Atmospheric Research): Changes in extremes such as the peak wind gusts at NSF NCAR must involve critical evaluation of all the factors that could have caused an apparent change, including different instruments and measurement locations. Only then can you go on to study what factors may have caused the change.
BAMS: How did you become interested in the topic of this article?
GM: A headline in the Denver Post on February 19, 2016 read, “148 mph wind gust recorded Thursday on Monarch Pass.” The article went on to report that “A blast of wind hit 148 mph on Monarch Pass Thursday, the highest gust recorded in Colorado by the National Weather Service. Thursday’s Monarch Pass blast bests a previous gust of 147 mph on 25 January 1971 recorded at the National Center for Atmospheric Research in Boulder.” This got several of us to thinking, “Wow, there was a 147-mph wind gust at NCAR!” The epic downslope windstorms of the 1960s, 1970s, and 1980s, with wind gusts measured at the NSF NCAR Mesa Lab that routinely topped 120 mph, had seemed to have reduced in intensity over time. This led to the logical question “Why?”, and our article is the outcome of the resulting research.
BAMS: What surprised you the most about the work you document in this article?
GM: We weren’t sure the apparent reductions in peak gusts at NSF NCAR were real. But after making parallel apples-to-apples measurements with two anemometers in the two locations, it became clear that they were real. The correspondence with similar changes in the large-scale reanalyses added further proof. It’s great to see evidence from different sources fall into place and reinforce each other. That doesn’t always happen in research!
BAMS: What was the biggest challenge you encountered while doing this work?
GM: As with many observational studies, obtaining high-quality long-term records of wind measurements was a challenge. Only anecdotal accounts of peak gusts from the early windstorms in the 1960s, 1970s, and most of the 1980s were available, so those sources were used to compare to the more recent wind measurements made at NSF NCAR.
“McKenzie Larson, a PhD student at the University of Colorado and a coauthor of our paper, is leading the next phase of the research. She’s using the weather research and forecasting (WRF) model to run case studies of strong downslope wind events to systematically study changes in mean climate we have identified that may affect the characteristics of mountain wave formation and consequent severe downslope wind events.”
—Gerald Meehl, NSF National Center for Atmospheric Research