by John Lanzante1
The expression in the title is something to which we all can relate. All else being equal, we feel warmer as the humidity increases. Regulation of human body temperature depends on more than just the ambient air temperature indices such as “wind chill” and “heat index” that have been developed to express what temperature the average person feels under certain ideal conditions. The latter is used as a metric of comfort due to the combined effects of air temperature and humidity. Forecasters, including those at the National Weather Service (NWS), make frequent use of such indexes to convey not only a sense of comfort, but more importantly, conditions that may have an adverse effect on human health in the form of morbidity or even mortality.
Although there are a considerable number of such heat indices, one of the most commonly used was presented by Robert Steadman in 1979. Steadman derived his index via a complex set of equations that were meant to capture the combined effects of temperature and humidity on the human body. He provided his results in the form of a look-up table, below.
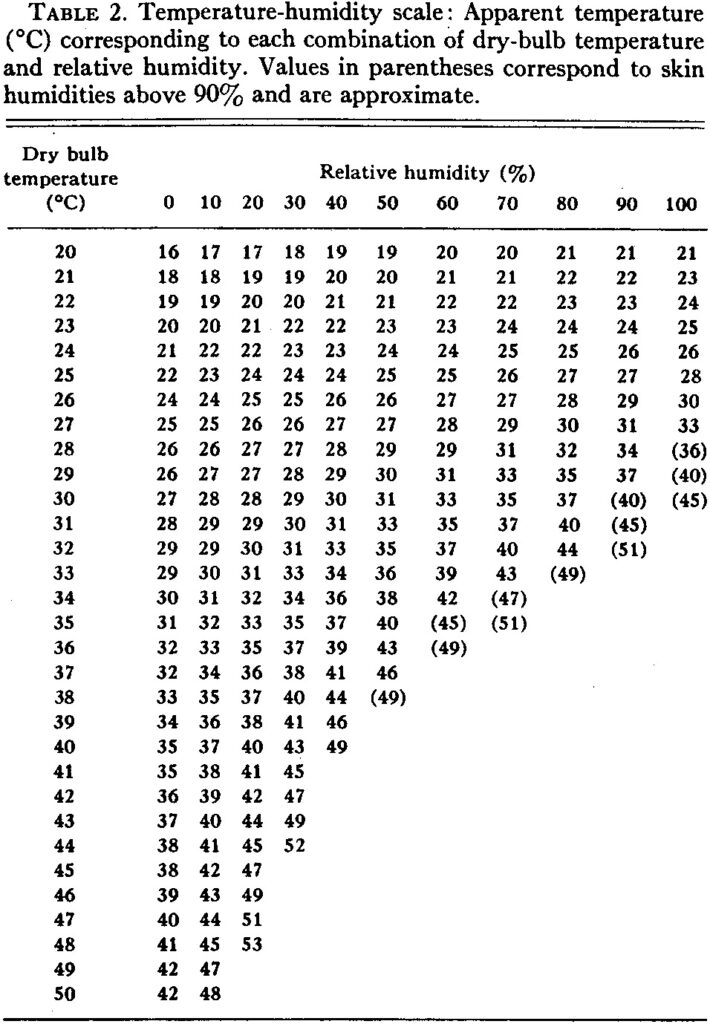
As time went on and computers became more widely available, there was a desire to automate the computation of the heat index. In 1990, Lans Rothfusz of the NWS facilitated this by fitting a polynomial to Steadman’s tabular values. In the decades that have passed, Rothfusz’s equation has been very widely used, and even today the NWS uses it as one of their metrics for issuing heat advisories.
Although Steadman’s and Rotfusz’s contributions have been enormous, there are some concerns that have been brought to light by Yi-Chuan Lu and David Romps in a series of papers beginning in 2022. Steadman’s model (along with Rothfusz’s polynomial) was by intention only valid for a range of conditions that existed prior to about 50 years ago. Conditions outside the valid range have been occurring more frequently, and are expected to occur even more in the future. As a result of this, Lu and Romps reworked Steadman’s model for application to conditions outside of Steadman’s range. Their revised model yields the “Extended Heat Index” (EHI) as compared to Steadman’s original “Heat Index” (HI).
The compelling arguments and examples provided by Lu and Romps provided motivation to present some examples to the wider AMS audience demonstrating how the EHI and HI differ both geographically as well as over time. For this illustrative exercise, future projections from one climate model along with data from 15 U.S. weather stations for the summer (June–August) were utilized. Because climate models may not realistically represent some aspects of the climate, techniques known as “statistical downscaling” were applied to the model data. Such techniques are “relatives” of Model Output Statistics (MOS), which are widely used in providing “corrected” versions of weather variables output from weather forecast models.
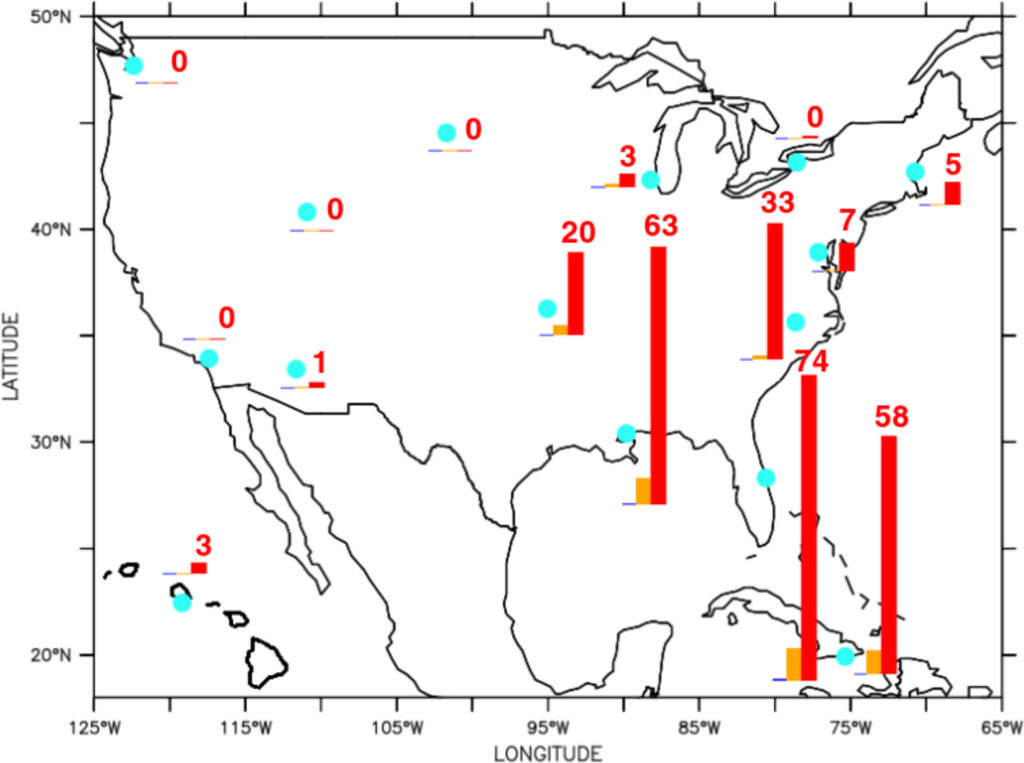
The findings demonstrate that during the recent past (1985–2014), EHI and HI differ only minimally. In the near (2031–2060) and far (2071–2100) future, much greater differences emerge. However, there is a strong geographical dependance to the differences. In the western half and northern tier of the continental United States, differences are minor even in the far future. But in regions frequently under the influence of subtropical moisture, such as the Gulf Coast, coastal Southeast, and the Caribbean, the differences are substantial in the far future.
For some stations, in these locations the EHI exceeds the HI by an exceptional amount for more than half of all summer days. Typical differences between the EHI and HI for these cases are ~ 5oC and sometimes greater than 10oC. More importantly, the differences are larger for the most extreme days.
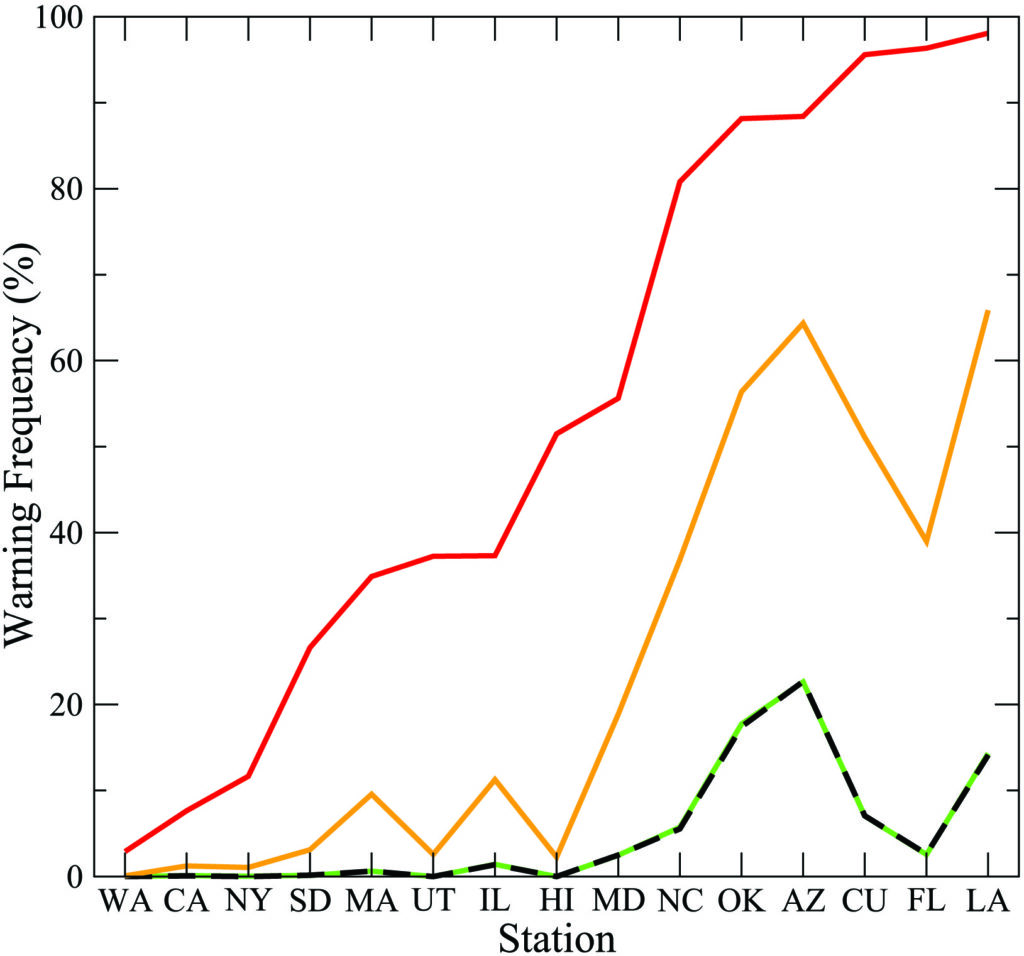
Additionally, the frequency of excessive heat stress events increases at all stations, and dramatically at some. For about half of the stations, which would rarely receive a public alert from the NWS in the recent past, alerts would be issued about 5%–50% of the time at century’s end. But for about 40% of the stations, where past alerts occurred about 5%–20% of the time, alerts would be issued on more than 80% of all summer days!
It is important to stress that (as detailed in the full article) this study was not intended to provide the final word on this topic. It is a demonstration project intended to motivate further work that employs the EHI. Uncertainties due to specific choices made here—all of which are reasonable—should be explored in more detail. Nevertheless, the findings here imply that use of the HI rather the EHI would lead to a considerable underestimate of the potential heat stress that humans could experience in the future, and that the potential for large increases in future heat stress exists for a substantial portion of the United States.
A Brief Conversation
with the Author
“From a young age, I was interested in science. Weather was one topic of particular interest, perhaps because I spent so much time playing outside as a child. I was an unapologetic ‘weather weenie.’ I recorded daily readings from my backyard rain gauge and min/max thermometer. I compiled monthly and annual statistics from my readings as well as from daily U.S. weather summaries in the newspaper. If I was playing in the backyard when my favorite TV weathercaster came on, my friends had to pause our activity so I could run inside and sketch the positions of highs, lows, and fronts on the U.S. basemaps that I would add to my archive. I guess it was inevitable that I would gravitate to a career as a statistical climatologist!”
—John Lanzante, NOAA/Geophysical Fluid Dynamics Laboratory

BAMS: What would you like readers to learn from this article?
John Lanzante (NOAA/Geophysical Fluid Dynamics Laboratory): First, that the Steadman heat index, which for the past 40 years or more has proven to be an extremely valuable tool for communicating heat stress, is becoming more prone to underestimating the risk as temperatures rise in the future. Fortunately, the extension of this index by Lu and Romps provides a backward-compatible replacement suitable for use in studying the future climate. Second, that there is the potential for summer heat stress to increase substantially in some regions of the United States, whereas other areas may experience more modest changes.
BAMS: How did you become interested in the topic of this article?
JL: I became aware of the Extended Heat Index as a member of GFDL’s Empirical Statistical Downscaling (ESD) team. Several years ago, our team embarked on a new venture exploring the heat/human health connection. We found the work by Lu and Romps to be compelling—so I was motivated to explore the differences between the original and extended versions of the heat index as a compliment to other ongoing work by the team.
BAMS: What surprised you the most about the work you document in this article?
JL: I was shocked by the projected increase in the number of summer days that would trigger a heat alert at some stations at the end of the century. Stations in regions with the highest levels of absolute humidity saw increases from ~10% of the days in the recent past to ~90% or more in the far future.
BAMS: What was the biggest challenge you encountered while doing this work?
JL: Trying to find a suitable set of stations was an arduous task. I wanted to have a small set that sampled the various U.S. climate regimes and geographic regions. Although there are thousands of potential stations from which to select, many have gaps of missing data. It was a balancing act between getting a station in the right location and having a long record of data.
“The GFDL ESD team has several current lines of inquiry regarding heat and human health. We’ve found that how you compute the daily heat index matters. Using a daily maximum temperature and minimum relative humidity does not always yield the same daily maximum heat index as computing the heat index on an hourly basis. We’ve also found that bias-adjusting temperature and humidity separately vs. bias-adjusting them jointly can impact the heat index. Finally, we’ve found that how temperature and humidity covary can differ substantially between stations as well as models—and this can greatly impact the computed heat index.”
—John Lanzante, NOAA/Geophysical Fluid Dynamics Laboratory
- Key messages from “A New Heat Stress Index for Climate Change Assessment,” by John R. Lanzante (NOAA/Geophysical Fluid Dynamics Laboratory). Published online in BAMS, December 2024. ↩︎