The State of the Climate report, the most comprehensive annual global climate report, is published each year as a supplement to the Bulletin of the American Meteorological Society. The newly released State of the Climate in 2025 features contributions from hundreds of authors worldwide, and details record-breaking global greenhouse gas concentrations, fossil fuel emissions, sea level, and ocean heat, as well as other key trends, events, and phenomena.
In this post, we speak with Global Oceans chapter lead editors Denis Volkov and Renellys Perez about large-scale ocean changes in 2025. Read the Global Oceans chapter here [PDF].
What were your roles in the report?
As the chapter editors for the Global Oceans chapter (Chapter 3) of the State of the Climate in 2025 annual report, our role was to coordinate, compile, and provide a comprehensive synthesis of the ocean’s physical state and key biogeochemical indicators in 2025 compared with previous years and climatology. This chapter represents a monumental collaborative undertaking, integrating specialized contributions and critical insights from 68 authors.
What are some noteworthy trends or events you’d want to highlight from the global oceans in 2025?
If we had to highlight three defining stories of the global ocean in 2025, they would be:
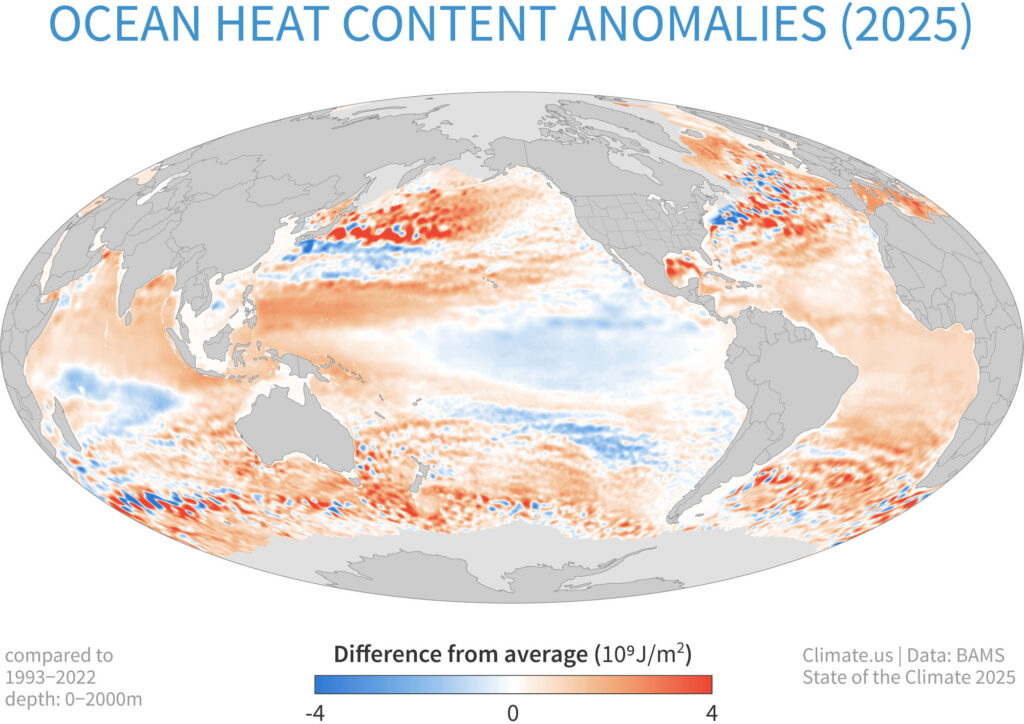
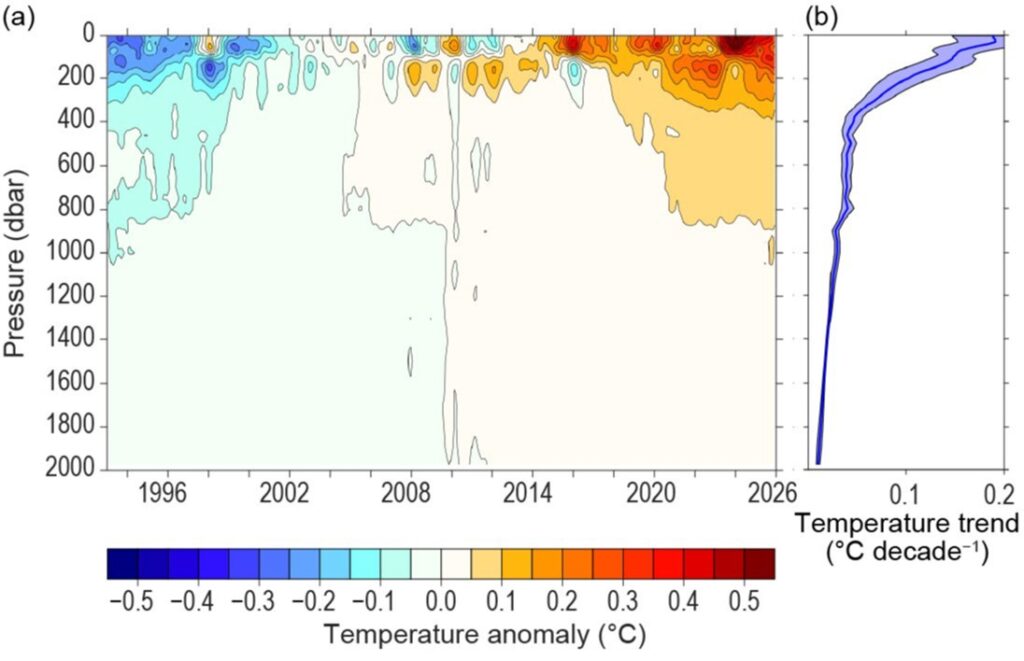
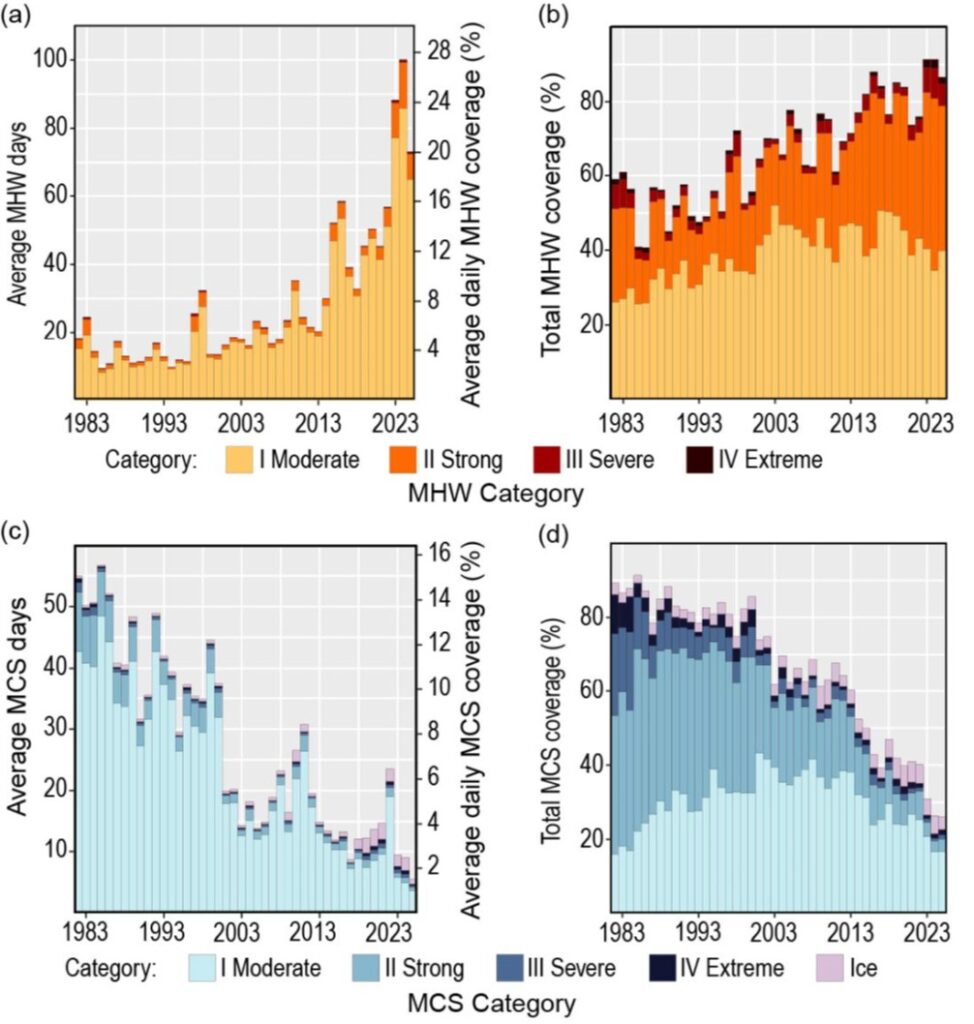
- Persistent, Near-Record Ocean Warmth: Global sea surface temperatures (SSTs) and ocean heat content (OHC) remained exceptionally high, marking the third consecutive year of extreme ocean warmth, despite the transition from a strong El Niño in 2023/24 to a weak La Niña bringing localized cooling to the tropical Pacific. Marine heatwaves remained widespread, affecting approximately 87% of the ocean surface at some point in the year.
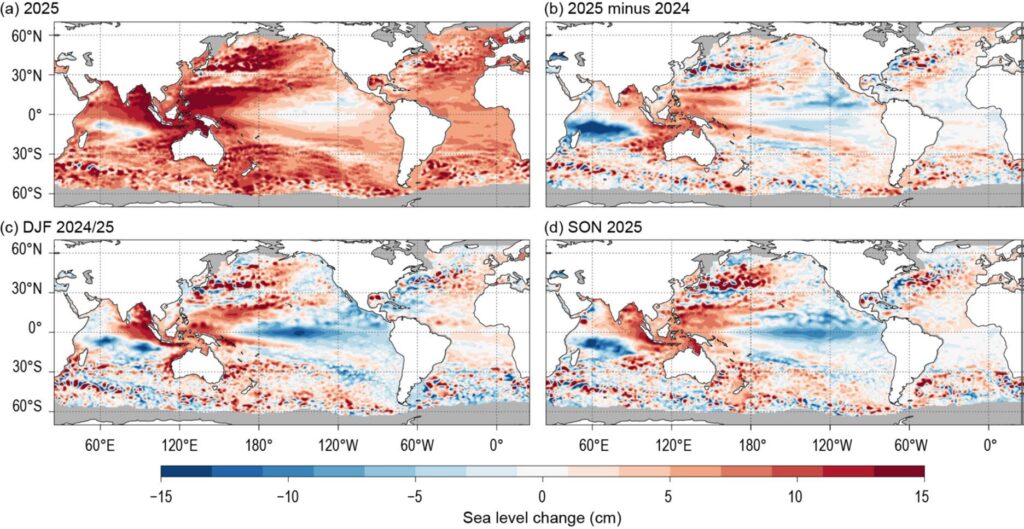
- Record-High Global Mean Sea Level: In 2025, global mean sea level reached a new record high of 111.2 mm above the 1993 baseline, continuing a long-term rise of approximately 3.5 mm per year, with clear acceleration in recent decades.
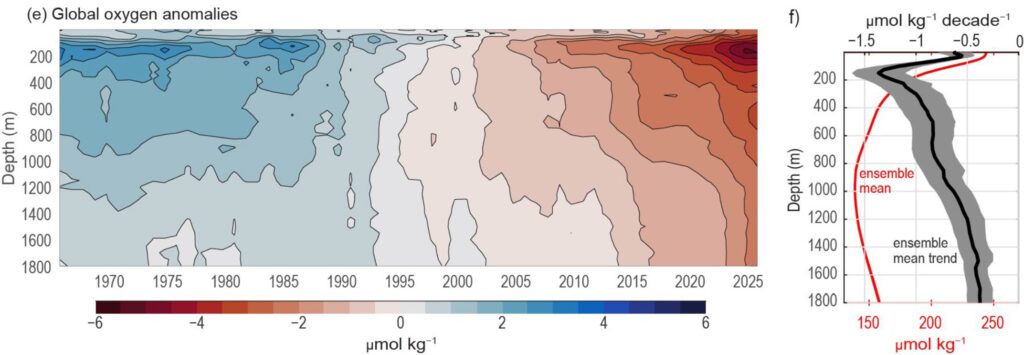
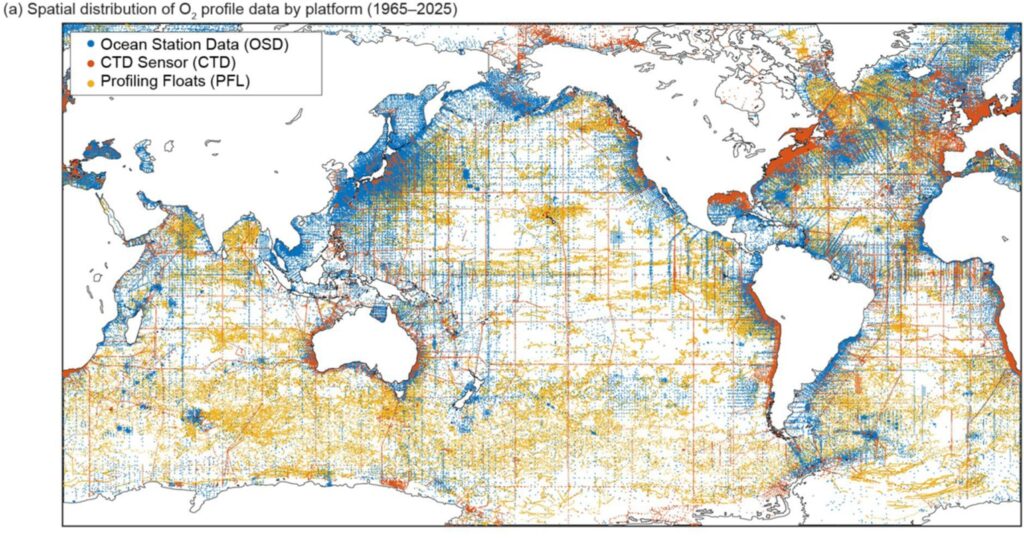
- Widespread Ocean Deoxygenation: For the first time, this year’s report features a dedicated section on dissolved oxygen (an essential climate variable). The data reveal a clear long-term trend: the global ocean dissolved oxygen inventory has declined by approximately 0.45% per decade since 1965, driven by ocean warming, reduced ventilation, ocean circulation changes, and enhanced biological respiration.
What was unexpected or differed from the norm last year?
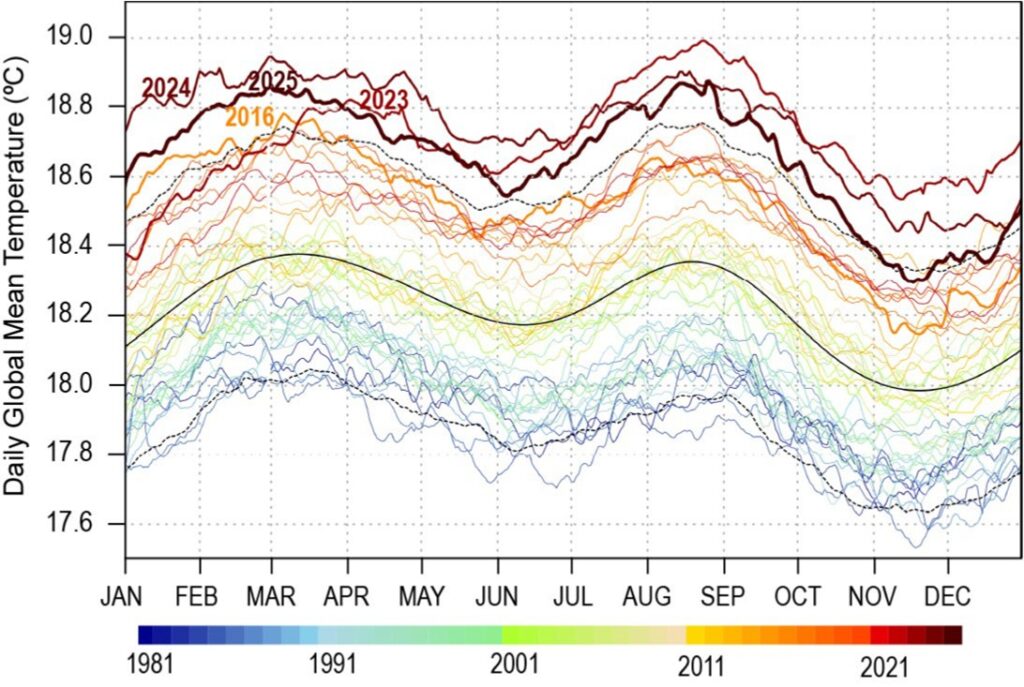
The transition to a weak La Niña did not suppress global temperatures as much as historically expected. Global mean SSTs remained above the 95% confidence interval (+1.96 standard deviations) of the 1991–2020 normal from mid-March 2023 all the way through early November 2025.
Global mean sea level increase from 2024 to 2025 was substantially below its long-term rate, likely due to La Niña-related transfer of freshwater from the ocean to land.
Marine heat wave occurrence declined from 2024, but marine cold spells declined as well and set a record low. Thus, the ocean experienced fewer of the most extreme hot events in 2025 compared with 2024, without a compensating rebound in cold conditions.
What developments in science and observing have affected this year’s chapter on the global oceans?
Machine learning and artificial intelligence are increasingly being leveraged to synthesize and map vast, heterogenously distributed oceanographic datasets.
During August–September 2025, 17 acoustic current meters and six ADCPs (Acoustic Doppler Current Profilers) were installed at Tropical Atmosphere Ocean (TAO) mooring sites as the first part of a Tropical Pacific Observing System field experiment. These instruments have been deployed for nearly a year, with the objective of resolving upper-ocean jets in the western equatorial Pacific.
The new dissolved-oxygen section brought together nine mapping approaches: five statistical interpolation methods and four machine-learning methods. This is an important advance because the oxygen observing record is sparse, heterogeneous, and much less mature than the temperature and salinity record.
Following the November 2023 submarine cable failure, Florida Current transport used in the AMOC estimate at 26.5N is now derived from cross-stream pressure gauges and satellite altimetry. This is a noteworthy example of alternative observing technologies maintaining a critical long-term record until the original system is restored.
We have also seen increased use of Surface Water and Ocean Topography (SWOT) altimetry and machine learning for surface current reconstruction.
What challenges still remain to gaining an accurate picture of global ocean climate factors?
Even with advanced technology, our field operations encountered unique hurdles:
Florida Current Cable Challenges: Historically, the northward flow in the upper limb of the Atlantic meridional overturning circulation (AMOC) at 26.5°N has been monitored via submarine cable measurements calibrated by routine research cruises. Following a cable failure in November 2023, continuity of the transport record has been maintained using bottom-moored pressure gauges and satellite altimetry, while these alternative estimates continue to be evaluated for long-term consistency. At the same time, efforts are underway to restore cable operations.
Instrument Biases: Operating in situ networks requires rigorous calibration, and cross-comparison between platforms remains an important step of the process employed in generating this report.
Data Gaps: Monitoring in remote, low-sampled basins brings additional challenges. As an example, Southern Ocean carbon sink estimates remained sensitive to individual observations due to shifting levels of surface carbon sampling, and interior carbon remains much more sparsely sampled than surface carbon. Similarly, ocean heat estimates below 2,000 m still depend on a relatively sparse Deep Argo network and ship-based CTD (conductivity temperature depth) observations.
Do you want to share any highlights from your work in 2025?
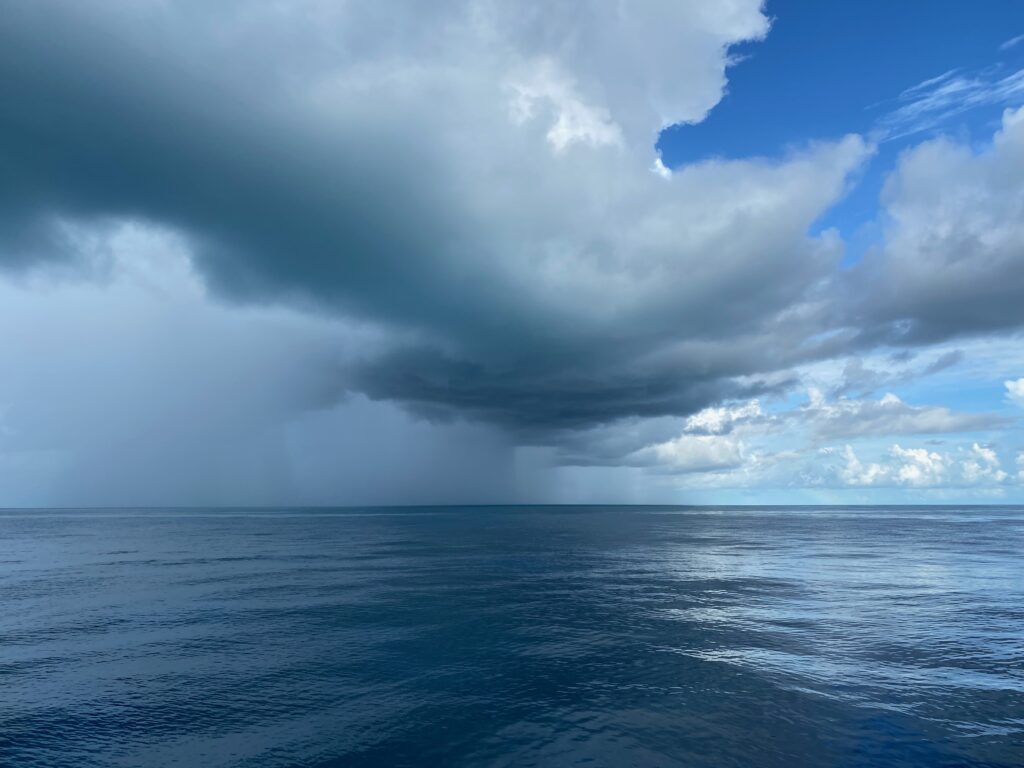
Science is not just about numbers; it is about the physical collection of data. Our team and authors were active on the water in 2025. One of our favorite highlights is a skyline view captured during a research cruise in the Florida Straits (between Florida and the Bahamas) in September 2025, showing dramatic rain clouds rolling over a calm, warm ocean. [Editor’s Note: See beginning of this article for the photo, which was the cover image for the Global Oceans chapter!]
What do you hope for or worry about in the year ahead?
Our Concerns:
- Persistent high ocean temperatures and continuing expansion of marine heat waves are driving faster sea level rise and increases in coastal extreme water level events, and accelerating ocean deoxygenation and acidification with consequences for marine ecosystems.
- Breaks in long-term records caused by aging infrastructure, logistical constraints, or failure of single-point observing platforms pose a significant challenge to assessing the state of our global oceans.
Our Hopes:
- We hope data coverage in undersampled regions will continue to improve to help close global sea level, heat, freshwater, and carbon budgets. In particular, we are excited about the expanded use of deep-ocean and biogeochemical monitoring platforms and uncrewed systems.
- We hope that technological advancements can reduce logistical impediments to obtaining data from our physical moored arrays, so that key ocean current and AMOC time series updates can be expedited and made less susceptible to single-point failures. Combining resilient physical arrays with emerging satellite missions and machine-learning algorithms will give us the high-resolution information we need to continue assessing the state of our global oceans.