by Patrick C. Burke1
In the early hours of August 21, 2021, an extreme rainfall event set a 24-h gauge record for Tennessee and spurred a flood wave that devastated the small city of Waverly, west of Nashville, killing 19 people. Although forecast tools are improving, predicting some extreme events remains elusive, particularly in summer, when atmospheric forcing is weaker. Given these challenges, the National Weather Service (NWS) forecasts for the Waverly event were reasonably good; a Flash Flood Watch was issued well before rain began. While the watch communicated the possibility of 50–100 mm (1.96-3.93 in.) of new rainfall, the event produced as much as 376 mm (14.80 in.) in one 6-h period at nearby McEwen, Tennessee, where the gauge record of 576 mm (22.68 in.) was also set. This led to an extremely rapid rise on Trace Creek and the resulting devastation at Waverly.
NWS Nashville and the Weather Prediction Center (WPC) adjusted to the severity of the event only as it became evident through radar-based rain estimates and observed data. Future use of storm-scale ensembles that use rapid data assimilation promises to help forecasters anticipate extrema that may only be predictable at shorter time scales. Thus, NWS Nashville, WPC, and the National Severe Storms Laboratory (NSSL) reviewed the Waverly event using a retrospective run of NSSL’s experimental Warn-on-Forecast System (WoFS) to determine how it could have influenced services during low-predictability, high-impact flash flood events.
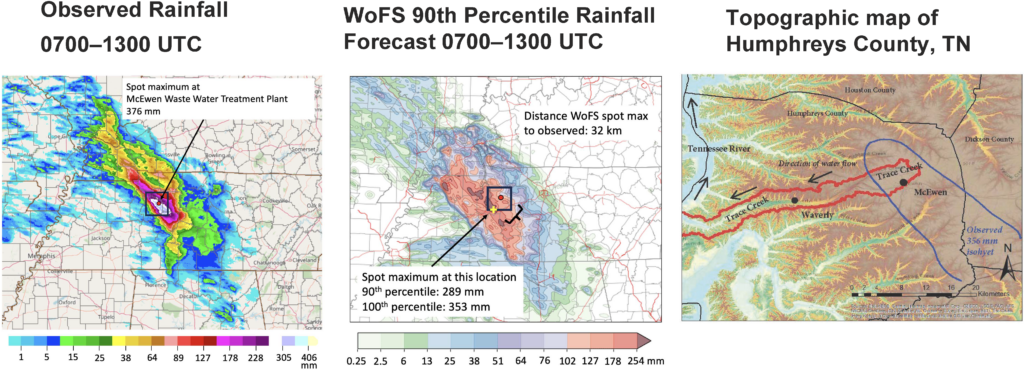
Immediately, the WoFS output looked compelling. The ensemble maximum 6-h rainfall was predicted at 340–409 mm (13.39-16.10 in.) in the vicinity of McEwen in consecutive model runs from 0400 to 0600 UTC, hours before the first flash flood warning. We sought context by documenting the timeline of forecasts from the NWS and operational models that night.
WPC upgraded western Tennessee and surrounding states to a Slight Risk of excessive rainfall at 1600 UTC the previous day, citing wet antecedent conditions and an increasing signal of excessive rainfall from the High Resolution Ensemble Forecast (HREF) system. We found that the 1200 UTC cycle of the HREF on August 20 had some accurate signals for where heavy rain would be located, but the amounts were not nearly heavy enough and did not stand out from erroneous heavy signals elsewhere.
The signal for placement, isolation of, and relative magnitude of the McEwen rainfall improved substantially in the 0000 UTC HREF cycle on August 21, about five hours before rain began. The probability of rainfall exceeding the 100-year recurrence interval for western Tennessee, about 190 mm (7.48 in.), rose to 40%. The WPC authors explain why this did not automatically prompt more urgent messaging: signals below 30% are, commonly driven by wet-biased individual members, while signals of 70% are seen as the most reliable; at 40% forecasters would have dug deeper and found that the 1200–0000 UTC individual-member trends for event placement were often in opposing directions. Additionally, one of the most trusted and frequently updating models, the High-Resolution Rapid Refresh (HRRR), provided inconsistent rainfall placement and coverage that evening, failing to inspire confidence in the model suite as a whole.
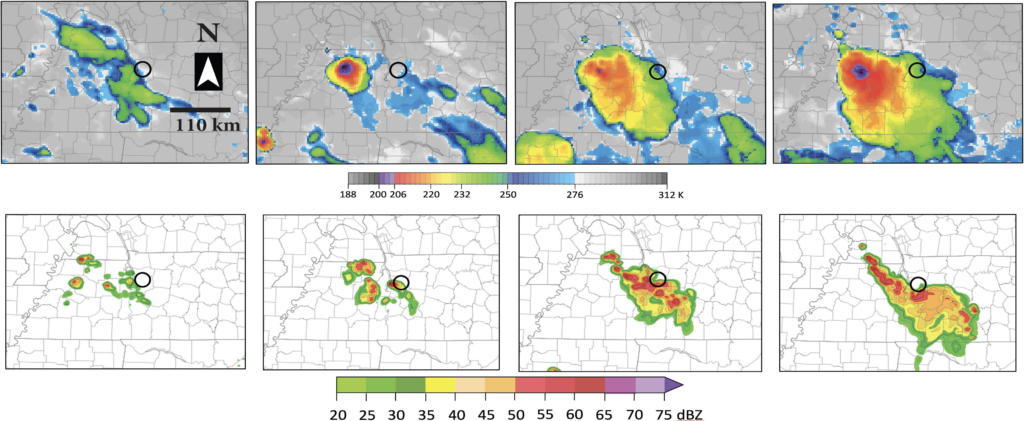
The HRRR later reflected a particularly steep trend in rainfall amounts across the 0800–1000 UTC runs; this was prior to the flash flood becoming an emergency but not prior to busy warning operations. Cue WoFS. As early as 0400 UTC, the WoFS retrospective run produced local extrema within the max percentile rainfall product indicative of the potential for a particularly extreme event—even sometimes within 50 km of where it occurred. While the spot maximum varied in location from run to run, the 6-h footprint of the precipitating system was consistent. Loops of other fields like simulated radar reflectivity, simulated infrared satellite, and member 5-min rain rate offered corroborating evidence of nearly stationary cell motion, mesoscale convective vortex development, and enhancement of low-level inflow. A telltale sign of tropical-style rainfall and rapid accumulation is the relative absence of a growing cold pool, and WoFS showed almost none.
If available, WoFS would have provided new context for trends in the HREF and HRRR. Minutes and hours gained in forecaster confidence can directly translate to one-on-one briefings to emergency managers and use of stronger language in public products. The WoFS information could have prompted NWS Nashville to contact partners as rain was beginning around 0500 UTC to warn of a potentially extreme event. They are confident partners would have welcomed heads-up phone calls even late on a Friday night. WPC forecasters noted they have seen WoFS handle flash floods favorably over the years, and the August 21, 2021, WoFS run would have provided a much clearer picture of the potential for extreme rainfall amounts and resultant high-end flash flooding.
Steve Martinaitis demonstrated some potential next steps in his March 2023 BAMS article. Using WoFS to drive probabilistic hydrologic forecasts from the Flooded Locations and Simulated Hydrographs (FLASH) system could become more viable with computing advancements. Transitioning WoFS to operations is another critical piece so it can become more widely available during rapid onset events. That effort began in April 2025, with the NWS leading a two-year demonstration period to increase WoFS availability.
Applying WoFS in Real-Time
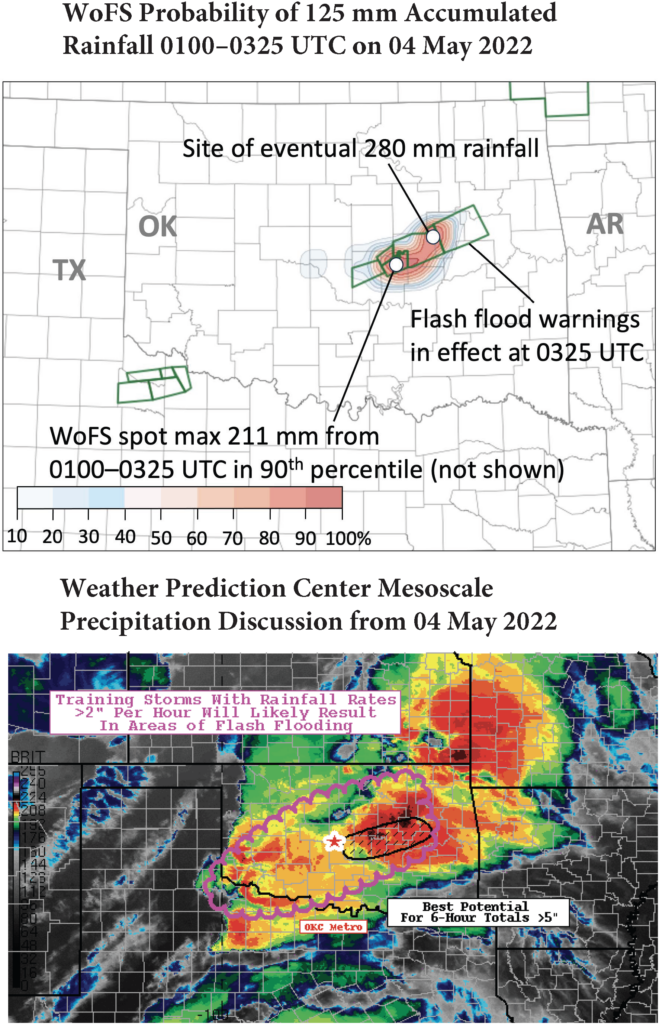
Real-world WoFS usage as hypothesized for the Waverly event has been documented in other cases. On May 4, 2022, WoFS directly influenced a Weather Prediction Center Mesoscale Precipitation Discussion (MPD) as well as the timing and content of Flash Flood Warnings during an event with 250–300 mm (9.84-11.81 in.) peak rainfall in eastern Oklahoma. The MPD cited WoFS forecasts of unusually high (200 mm; 7.87 in.) amounts in 50th-percentile rainfall and >60% probabilities of 51 mm (~2 in.) h–1 rates during successive hours. The National Weather Service Forecast Office in Tulsa reported: “The data were critical in helping us maintain situational awareness of the impending flash flood threat including the anticipation of a flash flood emergency.”
A Brief Conversation
with the Author
“Essentially, I’m a severe storms afficionado from Oklahoma. But my trajectory to the Warn-on-Forecast System job is pretty interesting. I was a National Weather Service forecaster for ten years at local offices and then eight years at the Weather Prediction Center. It must be somewhat rare to forecast at the local level, a national center, and then lead a research program. I actually worked at NSSL as a student, so it was an easy choice to come back here, and also to be close to family. Those diverse experiences set me up well for this job. At WPC I was the program lead for excessive rainfall, and I was plugged into headquarters efforts to improve delivery of rainfall and flood forecasts. But I also worked the senior forecaster desk, coordinating messages over the whole country and even for other countries during hurricanes. I remember one of the most unexpected twists was that I ended up on a conference call at 4 a.m. to advise the Irish Meteorological Service ahead of a recurving tropical cyclone. I became equally comfortable whether coordinating with numerous operational units during times of crisis or coordinating with agency leadership in a boardroom. That kind of mentality is perfect for Warn-on-Forecast, as I will sometimes shake hands with high-level visitors in the afternoon and chat with NWS forecasters about an ongoing WoFS run later that night. (For the full background story, see my interview in the October 2023 BAMS.)”
—Patrick C. Burke, NOAA/OAR/National Severe Storms Laboratory

Patrick Burke at the BioPark Zoo in Albuquerque, New Mexico.
“My biggest bucket list item is to make it to Antarctica. I did see wild penguins once in Melbourne, Australia, but the most recent best thing has been the wonderful penguin exhibit at the BioPark Zoo.”
BAMS: What would you like readers to learn from this article?
Patrick C. Burke (NOAA/OAR/National Severe Storms Laboratory): I think first we wanted to highlight this gap in our predictive skill that doesn’t often receive discussion. How is it that the forecast can call for four inches of rain and somebody gets twenty? I saw one or two handfuls of these events during my eight years at WPC, and it’s an area I’ve really wanted to attack to improve forecast messaging. Much of the challenge comes down to the fact that the ingredients for extreme rain are often floating around and intersecting, but they so rarely combine in this extreme way. If numerical models don’t catch it, then a forecaster would have little to no support for going out on a limb to forecast an extreme event.
That’s where we think a rapidly updating storm-scale ensemble like WoFS could help us make a breakthrough, and the Waverly, Tennessee, event is a perfect example. We included a lot of detail on forecasts from operational models for this event so the reader can kind of experience what it’s like for a forecaster trying to predict heavy rainfall. I’m not sure the story has been told quite through that lens before. This also allowed us to demonstrate where and when WoFS could have influenced messaging by providing greater context and support for important trends that did show up in other models.
BAMS: How did you become interested in the topic of this article?
PB: Back in 2021, WoFS did not run as frequently as it now does in the summer and fall seasons, but National Weather Service offices would sometimes request a retrospective run. During a short span we received requests to run the Waverly flood event (August 21) and the mid-Atlantic event from Post-tropical Cyclone Ida (September 1). I remember thinking smugly that the Ida run was going to be way more interesting because it included flooding in New York City and a rare outbreak of strong tornadoes in the Philadelphia area. With Waverly I thought WoFS would either kind of hit the mark or it wouldn’t; there didn’t seem to be much room for nuance. So when I got my first look at the WoFS output for Waverly, I was absolutely floored. I knew that some gauge had measured about 21 inches of rain. I pulled up the 6-hour plot from the midnight run of WoFS, which would have been about the time of the first radar echoes, and it was showing a spot max of 18 inches!! I immediately knew we had something special here. We later reran the case to correct a minor code bug in WoFS, and that amount fell to 16 inches, which disappointed me until I looked at the gauge data, and for a 6-hour period this new amount was actually MORE accurate. Amazing!
BAMS: What surprised you the most about the work you document in this article?
PB: First, I’ll say that I was either a little surprised or just very impressed that NWS Nashville had a Flash Flood Watch in effect prior to the Waverly event. This was the middle of the summer doldrums where forcing mechanisms are disorganized and models struggle to capture the important scales.
What surprised me the most, however, was the degree to which one could have analyzed the WoFS output to find that it was producing 16 inches of rain in a very reasonable manner. The 5-minute resolution of the output really helps by enabling these seamless movies of storm evolution. I ended up with several conference presentations where I showed loops of individual member 5-minute rain rates, reflectivity, or synthetic infrared satellite imagery. All of these things were indicative of stationary convection, training convection, and satellite wedge signatures. Then you realize that the loop you just watched where this storm doesn’t move an inch covers six hours! I have never seen an operational model sustain convective cells in one place like that without terrain influence. I’m a strong believer that the NSSL 2-moment microphysics is making this possible.
BAMS: What was the biggest challenge you encountered while doing this work?
PB: What was not challenging was working with NWS Nashville and WPC. The Nashville forecasters had already started a write-up that became Section 2 of our full BAMS article. One of the gratifying parts of this is to help tell their story in a BAMS article that would have been challenging for them to complete given how operational shift work never takes a rest.
The most challenging part, though, was the figures. We had snapshots of output from the HRRR model and all the other HREF members, but it was hard to organize them in such a way to tell a story without showing a hundred different panels. I felt like the reviewers absolutely hated my first attempt at the figures. I say that because it just made me laugh at myself and what I find acceptable in a figure; I wasn’t upset. A lot of credit goes to Jon Zeitler, who waived anonymity and went above and beyond in instructing us how to improve the figures. I’ve not been a lead author too many times yet, and his instruction will definitely carry forward to my next efforts.
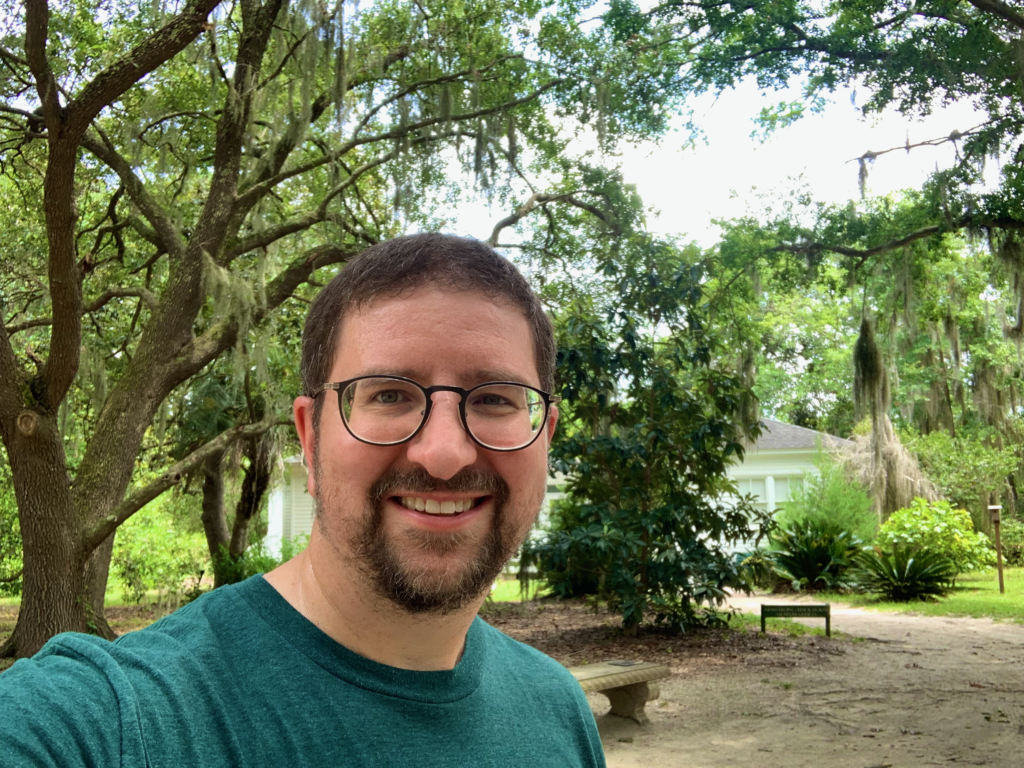
Patrick Burke at the Coastal Discovery Museum on Hilton Head Island, South Carolina.
“I’m at my happiest when I’m exploring and find myself in new and unexpected surroundings.”
“My recent BAMS articles have both been in the flash flood realm. The other thing I’m passionate about is increasing lead time for tornado warnings. That was a core motivation for developing WoFS. Although WoFS does not have the resolution to predict individual tornadoes, I have documented numerous cases where it seems to predict when and where a mesocylone is going to mature to produce intense swaths of near-ground rotation, and it does this at a 1–2-hour lead time. In March this year, WoFS gave NWS in Paducah, Kentucky, the confidence to call emergency managers in Carter County, Missouri, 2 hours before a long-track EF-3 tornado hit. I imagine the next time you hear from me it will be to tell that story, and perhaps the broader context of how WoFS is enabling such bold action in the most predictable cases.”
—Patrick C. Burke, NOAA/OAR/National Severe Storms Laboratory
- Key messages from “The 21 August 2021 Catastrophic Flash Flood at Waverly, Tennessee: Harnessing the Warn-on-Forecast System for Confident Prewarning Messaging of Extreme Rainfall,” by Patrick C. Burke (NOAA/OAR/National Severe Storms Laboratory), Joshua Barnwell, Matthew Reagan, Mark A. Rose, Thomas J. Galarneau Jr., Richard Otto, and Andrew Orrison. Published online in BAMS, October 2024. ↩︎