This article is part of a series featuring the Doppler on Wheels team and tornado season. Read the first article here, introducing the team.
This spring, as severe weather season ramps up, the Flexible Array of Radars and Mesonets (FARM) is out in the path of the storm. With its signature Doppler on Wheels (DOW) vehicles and related technologies, the research team, associated with the University of Alabama in Huntsville, has spent decades putting itself right in the way of the biggest weather it can find. This challenging, occasionally risky work is key to collecting valuable up-close observations of tornadoes, hailstorms, and other weather threats.
Being out with the DOWs involves a lot of driving and living off gas station food, plus occasional dents in the radar and getting stuck in the mud. But the scientific payoff is well worth it. The team is currently writing up the cases of two tornadoes it documented in 2024 that make it clear why their work is so valuable.
Damage
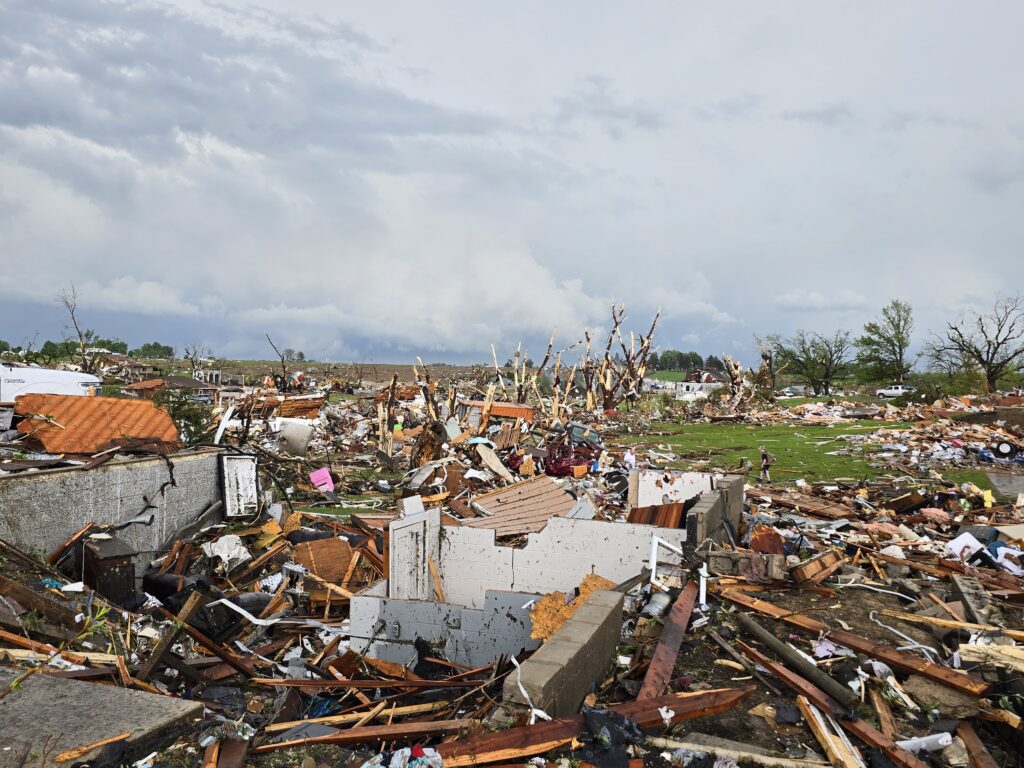
In one 2024 storm, which involved some close calls, the FARM team was able to capture data on a tornado that caused catastrophic damage in Greenfield, Iowa. “It was a very challenging mission day,” said DOW network founder Josh Wurman in a recent interview. “We thought the storms were going to be moving maybe 50 miles an hour, and they did, so we had a very hard time getting out ahead of one of the storms that looked like it was likely to produce a tornado.” The tornado touched down and the team was still playing catch-up. “We’re trying to race ahead, basically racing the train. When we finally got ahead, it was just about to go into the town of Greenfield.” In placing their instruments, the “SCOUT” team deploying mesonet Pods got very close to the main vortex; one of the DOW vehicles was also hit by a smaller, weaker tornado that was forming nearby.
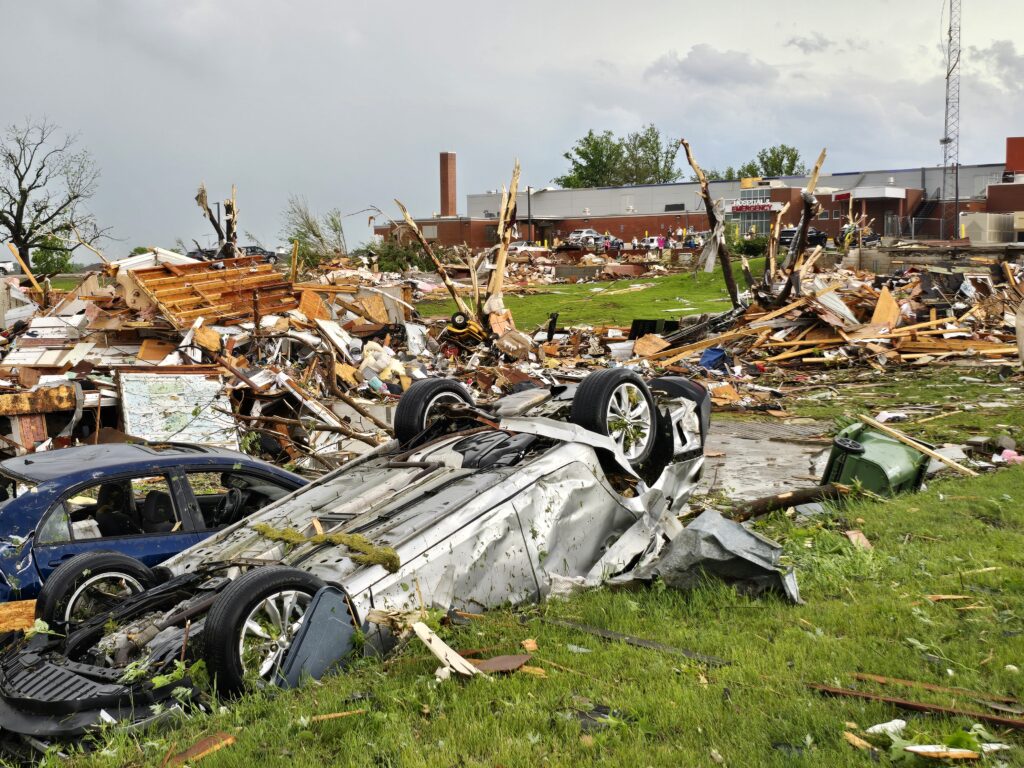
The storm left intense destruction in its wake. It rattled the research team when they drove in after the storm had passed. “It did major damage in that town,” Wurman said. “We were deployed just on the east side of town, and the tornado came within about 800 yards from our radar, but we were safely just on the side. We were scanning every 7 seconds, and collected some really useful data. Tragically, it killed some people when it went through the town, it damaged dozens and dozens of structures. But since we were there, we were able to at least get some nugget of something useful out of what was otherwise a really bad event.”
By scanning very near the surface as the tornado was destroying and damaging structures, they were able to closely correlate low-level wind speeds with specific types of damage, something that assessors normally must try to decipher after the fact. They hope that their data from Greenfield can inform better construction and improved tornado shelters in the future.
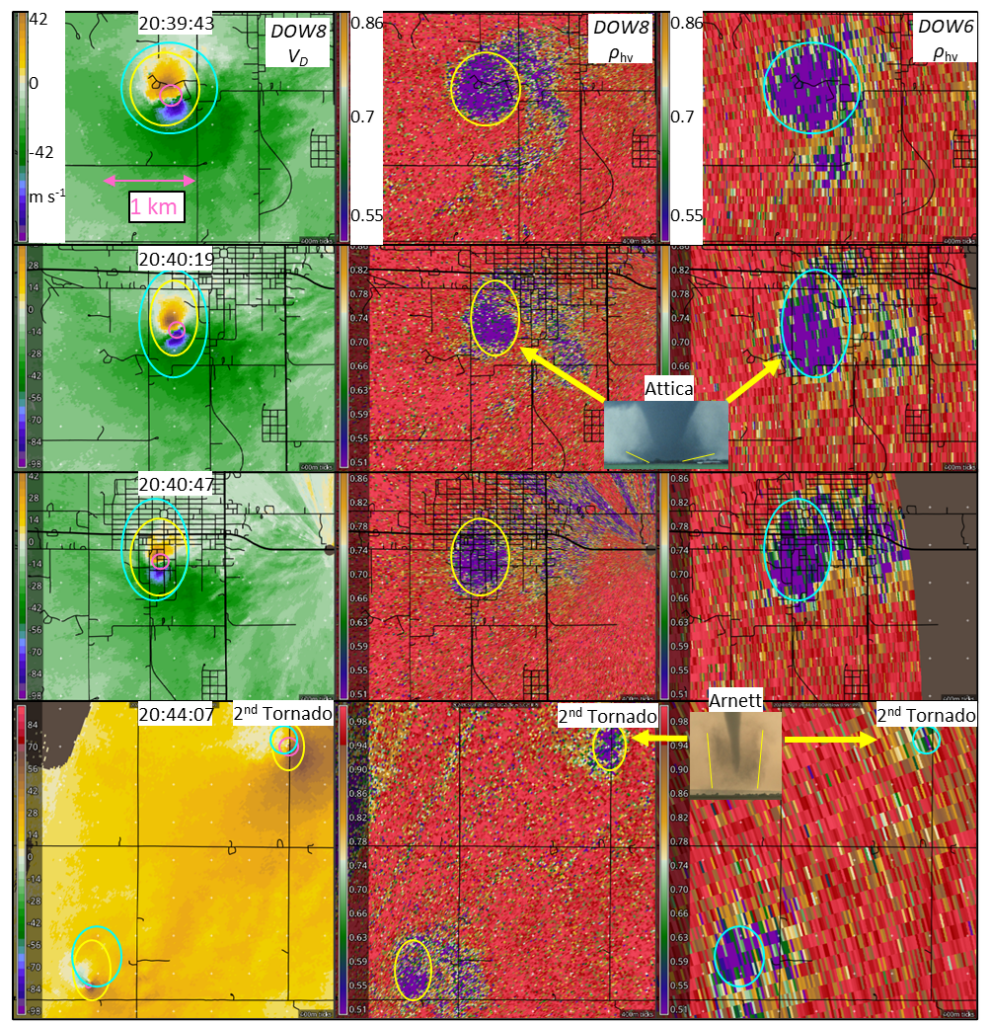
Correlation Coefficent (ρhv) images from Greenfield tornadoes as measured by both DOW6 (right column) and DOW8 (middle column); a second, weaker tornado is also shown in the bottom row, at 20:44:07 UTC (2:44 PM Central Time). Ovals enclose key tornadic features including maximum Doppler-measured wind speeds (left column, small pink ovals) and low-ρhv areas showing debris fields as measured by DOW8 (yellow) and DOW6 (cyan). The DOW6-observed debris region is larger than for DOW8 because DOW8 observations were taken higher above the ground. Photos from reference tornadoes in Attica, Kansas (2004) and Arnett, Oklahoma (2005) are shown for comparison, courtesy of Howard Bluestein. [Image credit: FARM Facility, from paper in review, Bulletin of the American Meteorologial Society]
In Greenfield, they were also able to collect a new kind of radar data, linear depolarization data (LDR), allowing them to examine characteristics of debris within the tornado. They believe they may have picked up a signal they can use to distinguish very large debris; it’s possible that this type of signature could allow National Weather Service radars to detect intense tornadoes by the size of debris carried aloft.
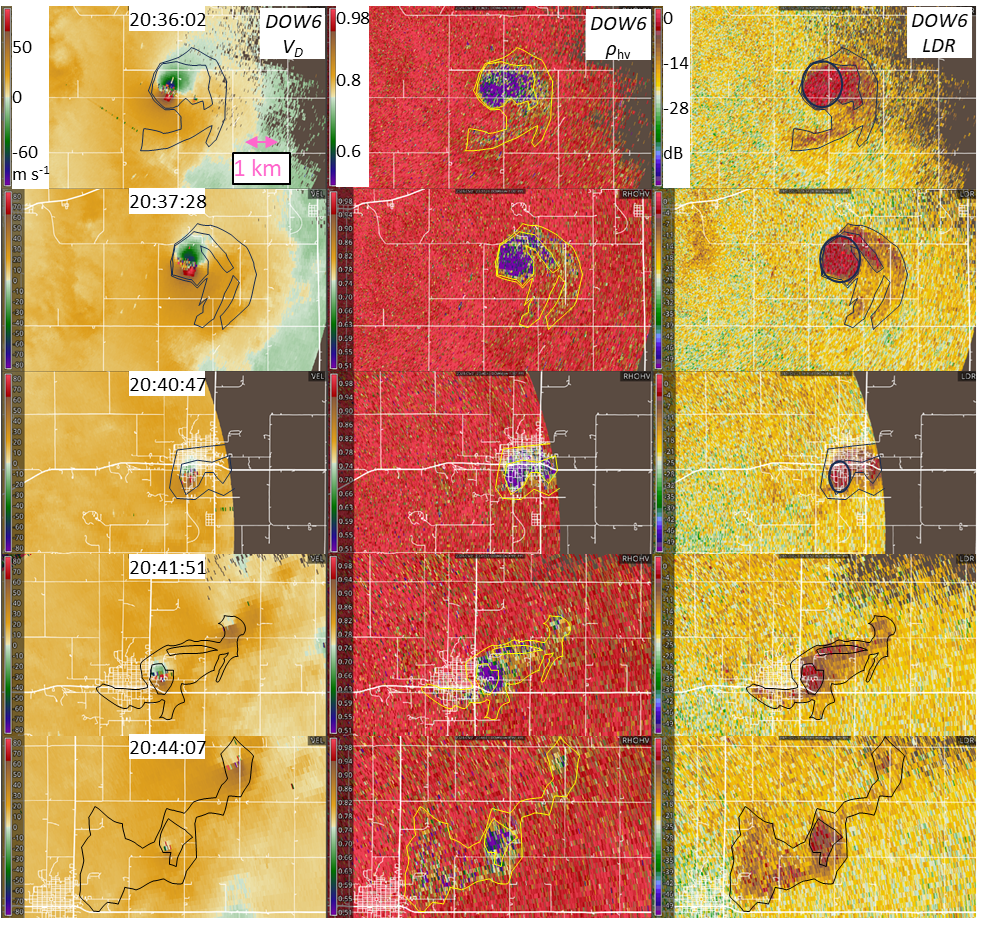
Rapidly evolving debris signatures in the two Greenfield, Iowa, tornadoes, taken between 20:36:02 UTC (2:36 PM Central Time) and 20:44:07 UTC (2:44 PM Central Time). DOW6 LDR (linear depolarization) images (right), ρhv (center), and Doppler Velocity (left) reveal a rapidly evolving, complex debris region. Extremely high LDR values (+4 to +7 dB) are observed. Low ρhv is evident in a smaller area. Debris is indicated well away from the strongest winds, and also bands of debris are spiraling/ejecting far from the main tornado. Settling debris is evident well after the tornado propagates to the east of the built-up area of Greenfield (see images at 20:44:07). [Image credit: FARM Facility, from paper in review, Bulletin of the American Meteorologial Society]
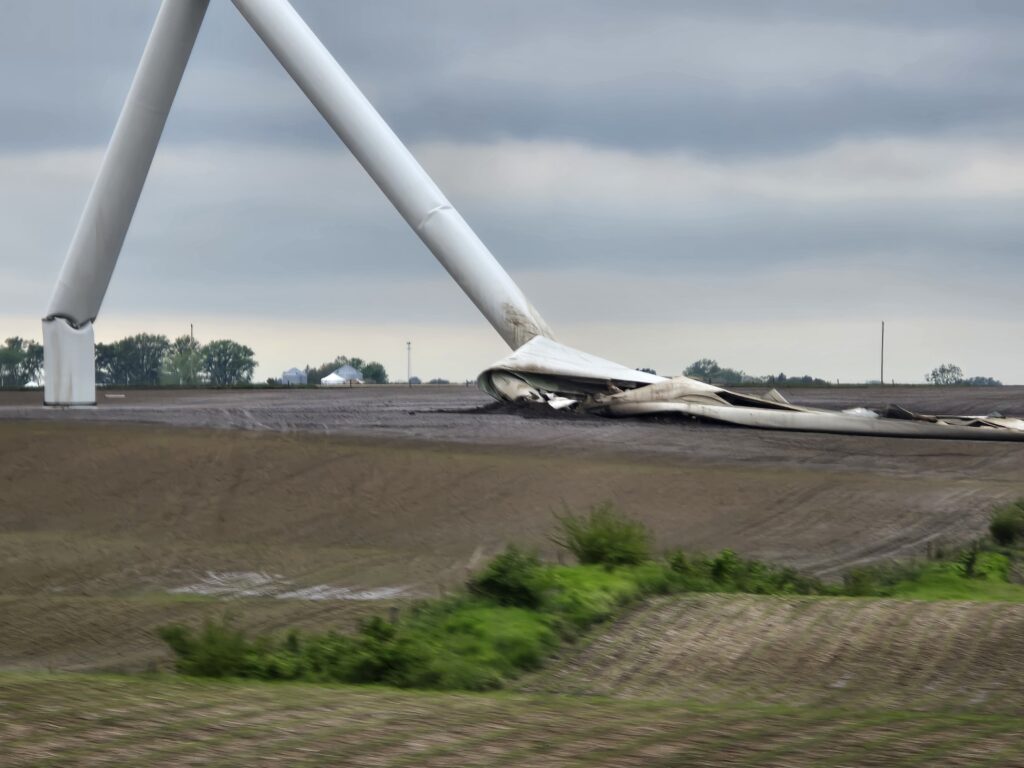
They also worked with storm chasers who were able to provide precisely timed and geolocated video, which the FARM team has integrated with radar data to examine how wind turbines outside Greenfield failed when struck by the tornado.
Evolution
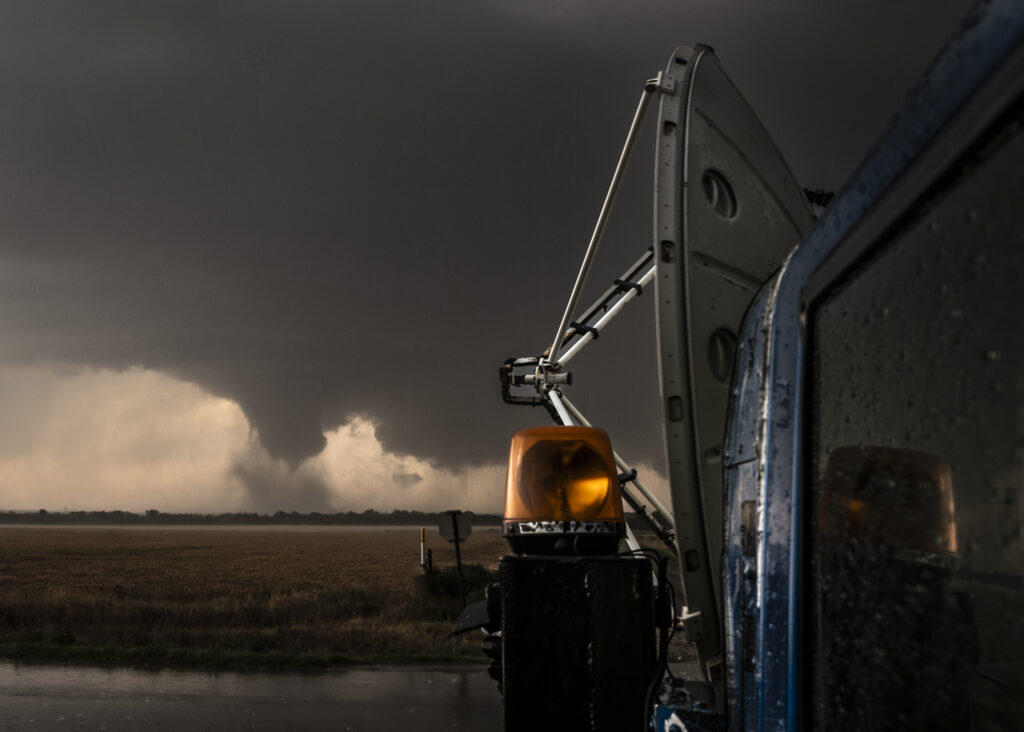
Another deployment in 2024 — just two days after Greenfield — saw the team almost perfectly positioned to view the full evolution of a tornado outside Duke, Oklahoma, getting some of the fastest-update-rate dual-Doppler wind speed observations on record. The Duke tornado deployment captured detailed radar information on the evolution and decay of an intense twister. “Even though it didn’t do much damage, because there wasn’t much to be damaged, we’re seeing really strong wind speeds in it,” said FARM team co-lead Karen Kosiba, who is currently writing up an analysis. “So, EF2 damage, but EF5-intensity winds.”
In addition, they documented different vortices spinning around the tornado and being ingested into it. It’s a process that some researchers believe to be involved in increasing a tornado’s intensity, but this effect wasn’t evident in the Duke tornado. “After that ingestion of the vortices, the tornado loses intensity,” Kosiba said. “You think the process might be favorable, and maybe it’s briefly favorable for intensification, but then after that it’s not.”
“The vortex goes in, you think the tornado’s going to get stronger but then, in fact, it weakens,” Wurman added. “It lasts for a long time as sort of a sick tornado but it’s no longer as strong.”
This just goes to show how much more information we still need to truly understand how tornadoes form and evolve. More sophisticated computer models have led to innovative new theories, and yet there are limits to what a numerical model can resolve and simulate — and limits on the observations that could ground-truth those models.
“Both models and observers like us have a really hard time near the surface, and that’s obviously the information that we’re trying to get,” said Kosiba. “Some of the things people see in the models are present in all these storms whether they’re making a tornado or not, or making a strong tornado or not. So we are trying to distinguish which of these processes not only are physically real but also actually contribute to the tornadogenesis or tornado evolution process. Hopefully, between models and observations we’re able to put together improved understanding.”
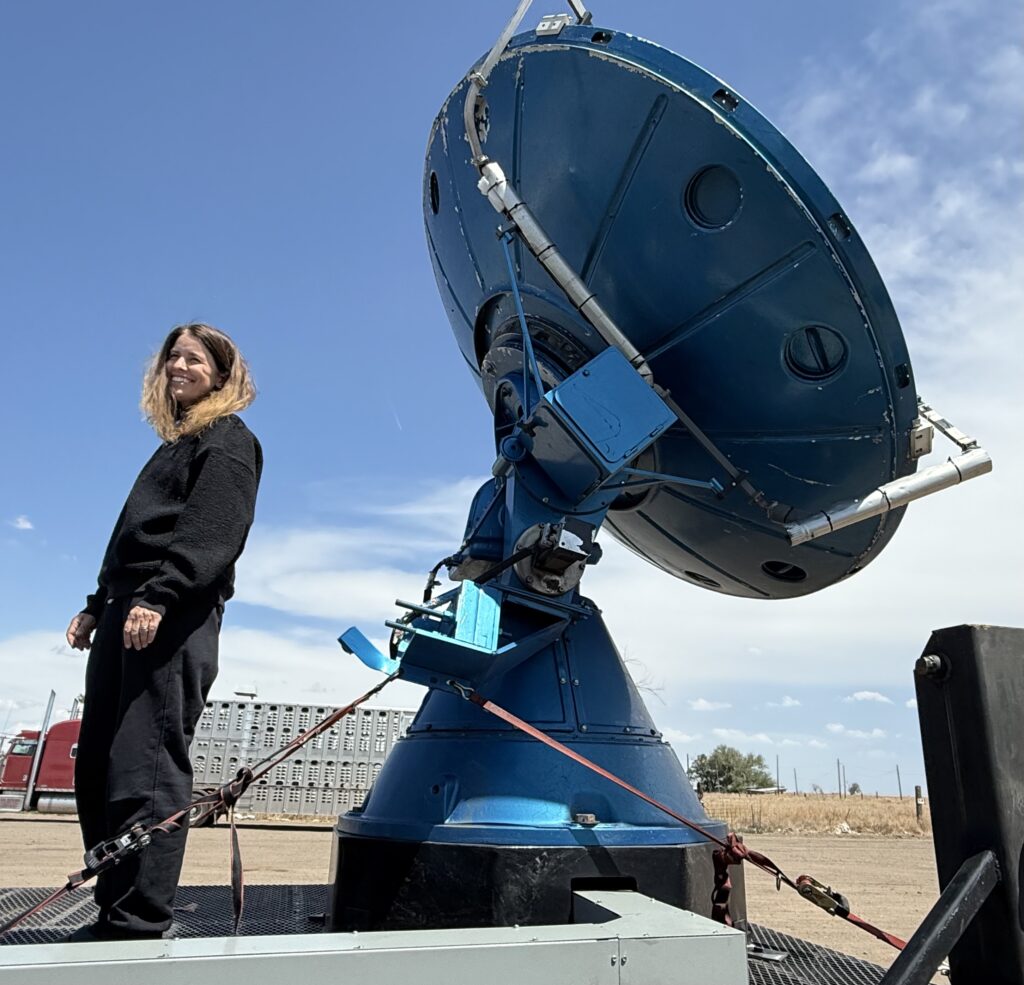
Karen Kosiba with DOW A in Colorado in 2026. [Photo credit: Jen Walton/FARM Facility]
Warning
Wurman hopes that with improved observations and modeling, we might finally be able to improve warning times. “Forecasting models are much, much better, but they’re still grossly unable to forecast precisely where and when and how strong tornadoes are going to be.”
The average lead time for a tornado warning is 13 minutes, similar to what it has been for decades, he noted.
“Even an hour ahead of time, you can’t look at one of these models and say, oh sure, this storm will make a tornado and this other one will not, or this third one over here’s going to make a strong tornado. Or hail – oh, that storm’s going to make the 4-inch hailstones and this other one’s gonna make the 1-inch hailstones. Right now, it’s a big cone of a tornado warning, and everybody run for their basement. You can’t really tell people how strong what’s coming their way is going to be; you can’t tell them if it’s going to go through the north side of town or the west side of town or whatever. It’s that kind of precision that’s necessary if you really want to improve what people do to stay safe.”
The two 2024 tornadoes make the stakes of such information clear. “This Greenfield tornado, one mile difference in track would have meant it never went through the town,” Wurman told me. “It would be a tornado that people other than scientists don’t remember, like this Duke tornado.
“One can imagine, if you had an hour’s notice in Greenfield that a very intense tornado was actually going to come through your town, maybe you could evacuate the town or get everybody to a community shelter. As it is now, the track forecasts are so imprecise and broad that you can’t be evacuating every town in the tornado warning. You’d be hurting people doing that, it’s a risky thing to do. If you had more lead time and more precision in those warnings you could take different actions.”